
Economic Indicator Review: ISM Manufacturing and Non-Manufacturing Indexes
January 24, 2020
Wiehan Peyper
Economic Indicator Review: ISM Manufacturing and Non-Manufacturing Indexes
Recent economic reports have focused a great deal on the latest updates related to the US ISM Manufacturing PMI (Purchasing Managers Index) as it continued to dip lower towards the end of 2019. Some economic commentators have taken a rather negative viewpoint with regards to future economic growth rates due to the lower economic activity from the production sector. A possible future recession has even been highlighted in some instances. The PMI economic indicator forms part of AOG’s economic overview watchlist and gets used in conjunction with numerous other indictors to provide the investment management team with an overview of the economic landscape. Let’s take a closer look at the PMI to see if recession fears sparked as a result of recent trends are warranted.
What is the PMI?
The Purchasing Managers Index is a diffusion index summarizing economic activity in the manufacturing sector in the US. The index is based on a survey of manufacturing supply executives conducted by the Institute of Supply Management. Participants are asked to gauge activity in a number of categories like new orders, inventories, and production and these sub-indices are then combined to create the PMI. A PMI above 50 would designates an overall expansion of the manufacturing economy whereas a PMI below 50 signifies a shrinking of the manufacturing economy.
PMI signals recession in 2012…2013…2015 & 2016. Did I miss it?
Figure 1 and Table 1 provides some perspective with regards to the recent changes in the PMI and highlights how this indicator has dropped below the 50 level in recent months. The long-term trend as displayed in Figure 1 does however provide some interesting points to note. Since the financial recession in 2008 and the subsequent market recovery the index has dipped below the 50 level on several occasions, without correctly signaling another recession. Levels below 50 can be seen in 2012, 2013 and for five consecutive months in 2015/16 yet the economy continued to provide positive growth rates over subsequent time periods. Earlier historical data provides similar observations of how a drop below 50 in the PMI was not followed by an immediate economic recession. As mentioned in the earlier section, the PMI calculation focusses on a survey of purchasing managers which by design could easily lend itself to sentiment bias rather than being based on actual activity – perhaps a reason why this indicator has not always been a perfect leading predictor of oncoming recessions.
Figure 1: US ISM Manufacturing Index (Dec ’79 – Present) – Gray bars represent US recessions
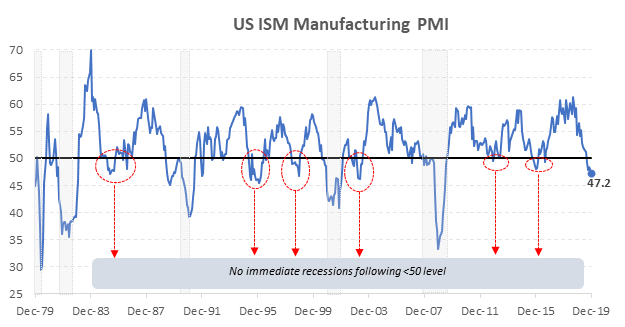
Source: YCharts Data (as at 1/13/2020)
Table 1: December ISM Manufacturing Index
| Institute for Supply Management Index* | Dec-19 | Nov-19 | Oct-19 | 3 Month Moving Avg | 6 Month Moving Avg | Year-ago level |
|---|---|---|---|---|---|---|
| Business Barometer | 47.2 | 48.1 | 48.3 | 47.9 | 48.6 | 48.6 |
| New Orders | 46.8 | 47.2 | 49.1 | 47.7 | 48.1 | 48.1 |
| Production | 43.2 | 49.1 | 46.2 | 46.2 | 47.7 | 47.7 |
| Inventories | 46.5 | 45.5 | 48.9 | 47.0 | 47.9 | 47.9 |
| Employment | 45.1 | 46.6 | 47.7 | 46.5 | 47.5 | 47.5 |
| Supplier Deliveries | 54.6 | 52.0 | 49.5 | 52.0 | 52.0 | 52.0 |
| Order Backlog (Not Seasonally Adjusted) | 43.3 | 43.0 | 44.1 | 43.5 | 44.2 | 44.2 |
| Prices Paid (Not Seasonally Adjusted) | 51.7 | 46.7 | 45.5 | 48.0 | 47.5 | 47.5 |
| New Export Orders | 47.3 | 47.9 | 50.4 | 48.5 | 46.3 | 46.3 |
*Seasonally Adjusted Unless Noted: 50+ = Econ Growth
(Source: First Trust Economic Blog)
(Source: First Trust Economic Blog)
What about Non-Manufacturing?
While much attention has been given to the ISM Manufacturing index in recent months, data from the larger service sector have been mostly overlooked. Developed countries such as the United States are increasingly moving toward a services-based economy, which makes analyzing this part of the economy even more important. Data collection for this sector of the economy has only been done since 2008 but will most likely receive greater focus as the economy continues to expand the services sector. Figure 2 and Table 2 provides an illustration of the solid growth in the Non-Manufacturing index over recent months, with numbers easily exceeding the 50 level. Growth in the services sector was broad-based in December with 11 out of the 17 industries delivering higher growth numbers. This healthy outlook in the Non-Manufacturing sector stands in direct contrast to Manufacturing sector and should not be overlooked for its importance in potential future economic expansions. So often do we read and see financial updates that aim to exploit sensational headlining to generate attention. Its only through a broader understanding of how various components of the economy fit together that emotional decision making based on fear is eliminated.
Figure 2: US ISM Non-Manufacturing Index (Mar ’08 – Present) – Gray bars represent US recessions
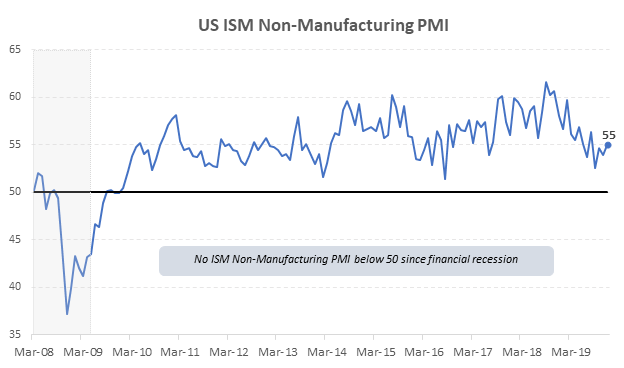
Source: YCharts Data (as at 1/13/2020)
Table 2: December ISM Non-Manufacturing Index
| Institute for Supply Management Index | Dec-19 | Nov-19 | Oct-19 | 3 Month Moving Avg | 6 Month Moving Avg | Year-ago level |
|---|---|---|---|---|---|---|
| Composite Index | 55.0 | 53.9 | 53.9 | 54.5 | 54.4 | 58.0 |
| Business Activity | 57.2 | 51.6 | 51.6 | 55.3 | 55.9 | 61.2 |
| New Orders | 54.9 | 57.1 | 57.1 | 56.0 | 56.0 | 62.7 |
| Employment | 55.2 | 55.5 | 55.5 | 54.8 | 54.0 | 56.6 |
| Supplier Deliveries (Not Seasonally Adjusted) | 52.5 | 51.5 | 51.5 | 52.2 | 51.6 | 51.5 |
| Prices | 58.5 | 58.5 | 58.5 | 57.9 | 58.1 | 58.0 |
*Seasonally Adjusted Unless Noted
(Source: First Trust Economic Blog)
(Source: First Trust Economic Blog)
Stay calm and call AOG
The declining PMI and the recession hype created from viewing data points in isolation serves as reminder to all that one economic indicator viewed out of context is never advisable. Here at AOG the ISM indexes are just one of many tools used to formulate investment decisions. It has always been our approach to take a well-balanced view when selecting investments for portfolios. The Endowment model strategy employed by AOG follows this same belief in that diversification is achieved by investing in a balanced portfolio represented by numerous asset classes.
The next time you get overwhelmed by the constant stream of negative economic data, be sure to contact one of our investment experts to break it down and provide clarity on how to best position your portfolio for potential future economic conditions.